Modeling Cognitive Control: RNNs and Representational Similarity Analysis
A published computational neuroscience study using RSA to compare how recurrent neural networks and the human anterior cingulate cortex represent hierarchically structured task sequences. Networks with explicit goal units better account for the representational geometry of human ACC.
A central question in cognitive neuroscience is how the brain implements cognitive control — the capacity to override habitual behavior and flexibly pursue goals across a structured sequence of actions. The anterior cingulate cortex (ACC) is a key node in this system, but the nature of the representations it encodes is debated: are they hierarchical, decomposing behavior into goals and subgoals, or purely distributed, encoding everything in a continuous learned state space?
The work described here addresses this question by training recurrent neural network models on structured sequential tasks and using representational similarity analysis (RSA) to directly compare their internal representations against fMRI data from human participants. This was a collaborative project: I led the computational modeling work, Iris Ikink contributed primarily on the fMRI and data analysis side, and Clay Holroyd was the PI. Published in the Journal of Cognitive Neuroscience.
The models and task
For the RSA study, participants performed a gamified “coffee-tea task” on a screen inside an MRI scanner: choose a beverage, make ingredient choices, and carry out the preparation sequence step by step using button presses. The sequences are short but hierarchically structured: a top-level goal (coffee or tea), subgoals for each ingredient, and individual motor actions. The same task was used to train the network models, enabling a direct representational comparison between model and brain.
Three recurrent network architectures were compared. The Elman network is a standard RNN: a hidden layer whose activations are copied to a context layer and fed back on the next time step, giving the network working memory across the sequence. The Goal Network extends this by adding explicit goal and subgoal units, recurrent output layers that actively represent the current high-level goal (“make coffee” or “make tea”) and the current subgoal (“add sugar,” “add cream,” etc.) throughout each sequence. These are trained jointly with the action output, providing a top-down signal that biases the hidden layer toward goal-relevant representations.
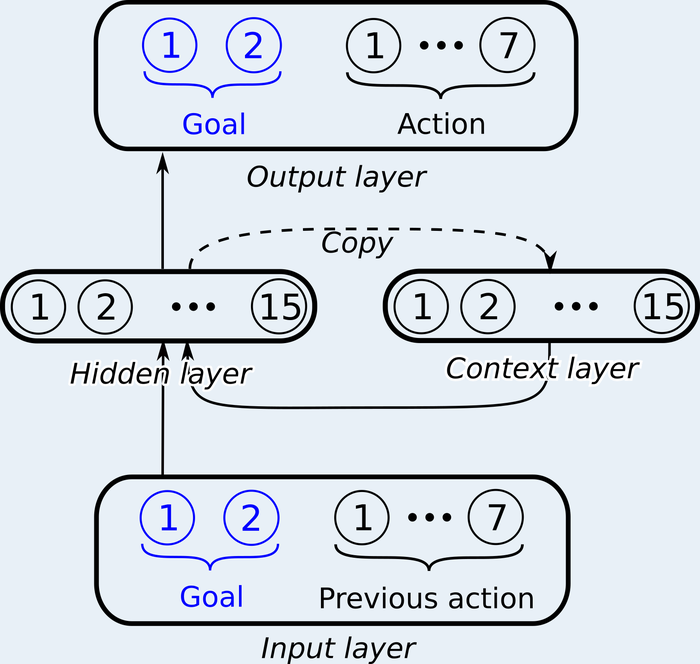
The Goal Network architecture. Goal and subgoal units form additional recurrent output layers that maintain active task context throughout the sequence, on top of the standard Elman context layer.
A third model, the Gradient Network, adds wiring costs to the loss function, specifically a penalty on long-distance connections within the hidden layer. This encourages the network to develop a spatial gradient of abstraction: units closer to the action output specialize in concrete, step-level representations, while units farther away capture more abstract, goal-level structure. This mirrors the proposed rostro-caudal gradient along human ACC.
A separate, larger-scale study (kitchen environment, 21 sequences) compared these architectures behaviorally and showed that goal units improve generalization to novel sequences, a prerequisite for the RSA work.
What is representational similarity analysis?
RSA is a method for comparing the representational structure of two systems (a neural network and a brain, for instance) without needing a direct mapping between individual units and voxels. The key insight is that you can compare geometries rather than representations themselves.
The method works in three steps.
Step 1: Extract activation patterns. For each condition of interest, record the activation pattern of the system. In this study, conditions are the distinct action steps in the task sequences. For the network, this is the vector of hidden unit activations at each step; for the brain, it is the fMRI BOLD response in a local brain region.
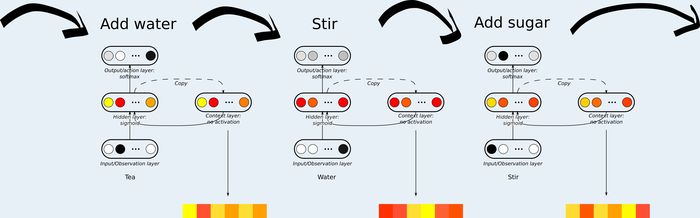
For each action step, the vector of unit activations in the Elman context layer is extracted. These vectors are the raw material for the RDM.
Step 2: Compute the RDM. Compare every pair of conditions using a dissimilarity measure (here, 1 − Spearman correlation between activation vectors). This produces a representational dissimilarity matrix (RDM): a symmetric matrix where each cell reflects how differently two conditions are represented — 0 means identical, larger values mean more dissimilar.
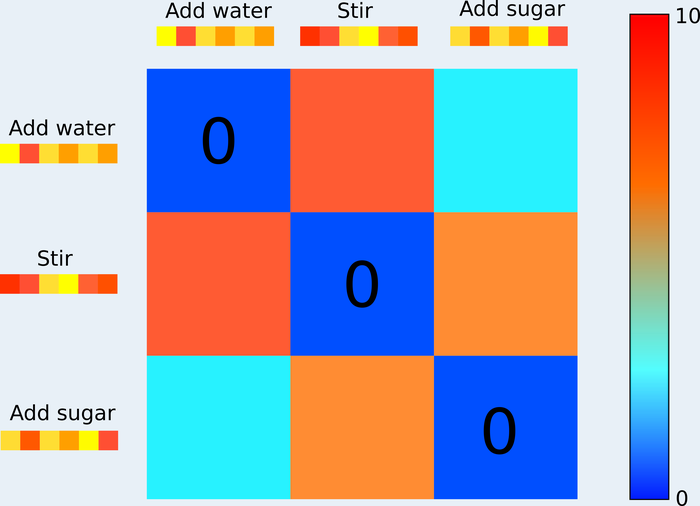
A cartoon RDM with a small number of conditions. The diagonal is zero (each condition compared with itself). Off-diagonal values reflect how differently each pair of steps is represented — lower values indicate more similar representations.
Step 3: Compare RDMs. Take the RDM from the network and the RDM from a brain region, and compute the Spearman rank-order correlation between their entries. A high correlation means both systems organize the same conditions in geometrically similar ways, even if the underlying representations are completely different in kind (unit activations vs. BOLD signal). This is what makes RSA useful: it is a second-order measure, agnostic to the representational format.
How RSA was applied here
For the network RDMs: hidden layer activations were extracted for each action step, and pairwise dissimilarities computed. For the Elman network this used the context layer; for the Goal Network, the context layer and goal units were analyzed separately; for the Gradient Network, subsets of units were selected by their proximity to the action vs. goal output layers.
For the brain RDMs: a searchlight analysis was used. A 3×3×3 voxel cube was slid across the brain. At each location, the BOLD response patterns across action steps were extracted from 18 participants, a group-level RDM was computed, and its Spearman correlation with the model RDM was calculated. Locations with significant correlation (p < .001, FWE cluster-corrected) indicate that brain region organizes the task steps in a way geometrically similar to the model.
What the representations encode
Before examining the brain results, it helps to understand what the goal units actually do to the network’s representational space. The t-SNE visualization below shows the trajectory of hidden layer activations across two sequences (one seen in training, one novel) and demonstrates what happens when goal unit activations are manually shifted to match a specific subgoal mid-sequence.
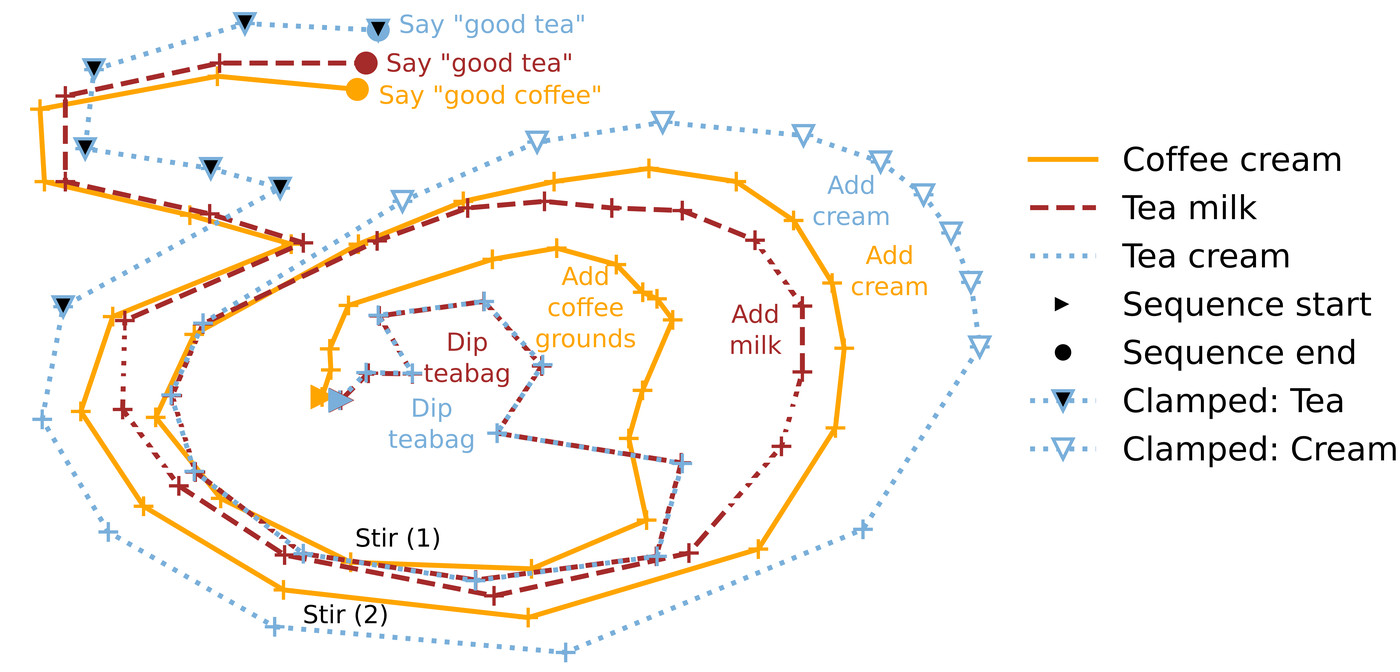
t-SNE projection of hidden layer trajectories for a training sequence (red), a novel sequence (blue), and a manually goal-manipulated sequence (orange). When goal unit activations are shifted to encode a target subgoal, the network’s internal trajectory moves toward the correct target — demonstrating that goal units directly steer the representational geometry, enabling generalization to sequences never seen in training.
Results
The Goal Network’s RDM shows strong block structure: coffee-preparation steps cluster together and are clearly separated from tea-preparation steps, reflecting the goal-level organization of the hidden layer. The Elman network’s RDM shows no comparable structure.
The searchlight confirms that this goal-structured representational geometry is present in the human brain. The Goal Network RDM correlates with ACC activity in a cluster of 798 voxels (peak t = 8.21), compared to 351 voxels (t = 7.18) for the Elman network — more than twice as large. Critically, the Goal Network cluster extends more rostrally into ACC, consistent with the proposed rostro-caudal hierarchy: rostral ACC encodes relatively abstract, temporally extended patterns (goals); caudal ACC encodes more concrete, step-level actions.
The Gradient Network makes this dissociation directly testable. When the RDM is computed from units closest to the action output, the searchlight finds clusters in caudal ACC. When computed from units closest to the goal output, clusters appear in rostral ACC and other frontal regions. This gradient emerges naturally from the wiring-cost penalty in the loss function, without any explicit architectural specification of where abstract vs. concrete representations should live.
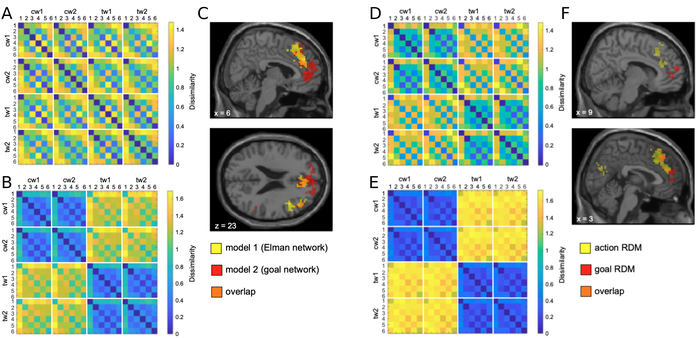
Six panels summarizing the main RSA results. (A) RDM for the Elman network context layer. (B) RDM for the Goal Network context layer — the goal-organized block structure (coffee vs. tea separation) is clearly stronger. (C) Brain voxels whose RDM significantly correlates with the Elman (yellow), Goal Network (red), or both (orange) models; the Goal Network cluster is larger and more rostral. (D, E) RDMs for the action units and goal units of the Gradient Network, respectively — the goal units show markedly greater tea/coffee separation. (F) Searchlight results for action vs. goal units of the Gradient Network: action units match caudal ACC, goal units match rostral ACC and other frontal regions.
What this means
The results support a view in which ACC encodes sequential task context in a representational geometry shaped by goal structure, not just the immediate action being taken. A network that explicitly represents goals encodes that geometry more strongly and more rostrally than one that does not, in line with the hypothesized rostro-caudal abstraction gradient. At the same time, these representations remain distributed: the goal units do not create a discrete lookup table but steer a continuous hidden-state trajectory.
RSA is what makes this comparison tractable. Comparing a neural network’s hidden activations against fMRI BOLD directly would require arbitrary assumptions about how units map to voxels. Comparing their RDMs sidesteps this entirely, asking only whether the two systems organize the same set of conditions in the same way, which turns out to be a meaningful and answerable question.
This work was carried out during my postdoc in Clay Holroyd’s Learning and Cognitive Control Lab at Ghent University, and was funded by the European Research Council under the EU’s Horizon 2020 programme (grant 787307).